Ocean Networks Canada

Ocean Networks Canada

Search form

Facebook iconTwitter iconLinkedIn iconYouTube iconFlickr iconInstagram icon

Menu

  • About Us
    • About Us
    • Jobs & Opportunities
    • Events & Workshops
    • Contact Us
    • Support Us
    • Annual Report 2019-2020
    • Organization
      • Leadership
      • Staff
      • Boards
      • Committees
    • Funders, Associate Members & Partners
      • Funders
      • Associate Members
      • Partners
  • Science
    • Science
    • Active Research
    • Highlights
    • Science Plan
      • Summary
      • Science Themes
    • Publications
      • General Interest
      • Academic
    • Getting Involved
      • Proposals
  • Innovation Centre
    • Innovation Centre
    • About the Innovation Centre
    • Success Stories
    • Contact Us
    • Smart Ocean™ Systems
      • Sensors and Instruments
      • Technology Demos
      • Ocean Observing Systems
      • Earthquake Early Warning
    • Partners & Networks
      • Industry Network
      • Global Partnerships
      • R&D Support
      • Students in Industry
    • Atlantic Partners
  • Learning
    • Learning
    • Learning Highlights
    • Learning Events
    • Partnerships
    • Contact Us
    • Ocean Sense
      • Community Observatories
        • Cambridge Bay
        • Campbell River
        • Kitamaat Village
        • Prince Rupert
      • Teacher Info
      • Student Info
      • Resources & Lessons
    • Get Involved
      • For Students
        • For Undergrads & Grads
      • For Educators
        • Educator Opportunities
      • For Communities
      • Ship2Shore
      • Citizen Science
        • Coastbuster
        • Digital Fishers
      • Youth Science Ambassador
    • Resources
      • Learning at Home
      • Educator Resources
      • Ocean Alive!
      • Oceanography 101
      • About the Observatories
      • Research Ideas
      • Student Reports
  • Observatories
    • Observatories
    • Arctic
    • Atlantic
    • Pacific
    • Mobile Platforms
    • Infrastructure
      • Data Facilities
      • Platforms
      • Devices & Sensors
      • Cables & Connectors
    • Expeditions
      • Wiring the Abyss
      • Expedition Logs
      • Maintenance Processes
    • Notices
      • Information for Mariners
      • Alerts and System Status
  • Data & Tools
    • Data & Tools
    • Highlights
    • Data Quality
    • Preview & Download
      • Preview & Visualize
      • Data Download Tools
      • State of the Ocean Plots
      • Ocean Report Card
    • Apps & Services
      • Mobile Apps
      • OPeNDAP Web Services
      • Related Sources
      • Earthquake Data Dashboard
    • Data Help
      • Usage Policy
      • Tutorials & Help Pages
      • Request Help
  • Sights & Sounds
    • Sights & Sounds
    • Terms of Use
    • Video
      • Live Video
      • Video Highlights
      • Video Archives
    • Images
      • Maps
    • Audio
      • Audio Highlights
      • Audio Archive
  • News
    • News
    • Stories
    • Newsletters
    • Calendar
    • Media Relations
      • Backgrounders
      • Downloads
      • In the News
      • News Releases
      • Media Contacts

About Us

You are here

  1. Home
Dec 9, 2011

Hydrate Growth at Bullseye Vent?

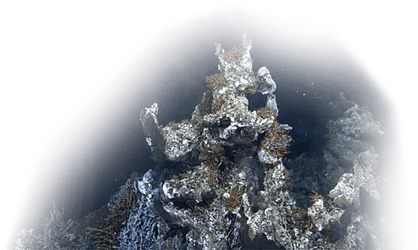
Close-up views of exposed gas hydrates in Barkley Canyon.

Gas hydrates are ice-like solids composed of natural gas, usually methane in marine environments, and water. Hydrates are known to exist in the Cascadia margin, west of Vancouver Island, beneath the seafloor. Sediment stiffness is increased by frozen hydrates, like ice in winter mud. The degree of stiffness is an indicator of the amount of hydrate present per unit volume. Gas hydrate outcrops, venting and topography in the Cascadia margin have been intensively studied and are observed to change over time. Does the volume of hydrates also change with time? University of Toronto researchers Lisa Roach and Nigel Edwards are trying to find out.

An uncommon, specialized exploration technique, known as seafloor compliance is used to probe beneath the seafloor, by examining the deflection of the seafloor caused by waves on the ocean surface. Waves on the surface create pressure changes on the seafloor; as they “push” the seafloor down, it deflects them. The amount of seafloor deflection depends on the stiffness of the sediment, which, in turn, depends on hydrate content. In areas where there are fewer buried hydrates, the seafloor is more compliant (less stiff). The depth at which hydrates are buried beneath the seafloor can be inferred from gravity wave frequency at the seafloor. A compliance value in the higher frequency range describes shallower hydrates, while lower frequencies describe deeper deposits.

Seismometer auxiliary platform at ODP 889.

Differential Pressure Gauge close-up.

Roach and Edwards are using this technique to study changes in buried gas hydrates in a place called Bullseye Vent at our Clayoquot Slope location (depth 1260m). To determine the change in compliance, pressure and velocity data were recorded at 1 second intervals for a total of 228 24-hour long records between 1 October 2010 and 16 May 2011. Pressure was measured with a differential pressure gauge (DPG), capable of recording pressure changes of 1Pa in a background of 1MPa, while very small velocities, associated with seafloor wave deflections as small as the radius of an iron atom, are measured by a broadband ocean-bottom seismometer (OBS). These instruments are part of the NEPTUNE Canada ODP 889 seismic station.

Broadband seismometer.

The grey area bordered with a dotted magenta line indicates the extent of gas hydrate in the region, while the grey line within this magenta region outlines the surface expression of Bullseye vent.

The best least squares fit to the average transfer function between 0.01-0.03Hz over the 228 days from 1 October 2010 to 16 May 2011. The errors on the trend range from 0.4% to 4% of the average transfer function, but are not shown here because they are too small to be displayed effectively in the plot.

A trend in the compliance over the 228 days was revealed (shown above). The trend represents a -2.88% change in the compliance of the sediments over the study period. This decrease in the compliance corresponds to an increase in the stiffness in sediments (indicating an increase of gas hydrate amount) between 0-600mbsf (metres below seafloor). Hydrates are stable within the top 225m of sediments, so a change in compliance could have been caused by property changes over this depth range. To match the decrease in compliance to the increase in hydrate content, the stiffness of the layer between 0-100mbsf (initial hydrate content of 22%) was varied until the -2.88% change was observed following a model suggested by the IODP drilling. A rather surprising three fold increase in hydrate concentration of the 100m layer, from 22% to 64% is predicted.

Flow diagram depicting the observed changes and simulated results derived from this study.

Assuming a 100m diameter hydrate mass, the change in hydrate concentration is equivalent to a change in hydrate mass of 600 million kg, which poses the question where does this mass come from? If this decrease is distributed over the entire hydrate zone (~250mbsf) the change in hydrate concentration and mass would be smaller. Maybe the zone of increased stiffness extends to greater depths and is in a layer associated with a hydrate production mechanism?

As more high-resolution data are collected in the future, scientists will gain increased understanding of how fluctuations in compliance relate to the dynamics of the hydrate system and its evolution. There is still much to be learned!

clayoquot slope | barkley canyon | gas hydrates | cascadia | seafloor compliance | Bullseye Vent | seismometer | differential pressure gauge

Printer-friendly versionPDF version

Related Stories

Expedition 2019: Highlights Story Map
Nov 14, 2019

New research shines a light on the importance of submarine canyons
Sep 14, 2018

From Cosmos to Core: Wiring the Abyss Expedition 2018
Sep 12, 2018

New study quantifies natural flux of methane gas in the northeast Pacific
Sep 11, 2018

Earthquakes, pyrosomes, robots, and big seas
Jul 18, 2017

Canadian scientist awarded for exceptional contribution to Earth science!
Aug 23, 2016

Deployed: the first spike for British Columbia's earthquake early warning system
Jul 27, 2016

Calendar of Events

March 2021

  • « Prev  
  •   Next »
S M T W T F S
28
1
2
3
4
5
6


7
8
9
10
11
12
13


14
15
16
17
18
19
20
 
Pacific Rim Whale Festival
»


21
22
23
24
25
26
27
«
Pacific Rim Whale Festival


28
29
30
31
1
2
3


Newsletter

Sign up for our monthly e-newsletter:


Tweets Follow @Ocean_Networks


Highlights

  • Audio
  • Data
  • Learning
  • Science
  • Video

Reading Room

  • Active Research
  • Backgrounders
  • FAQs
  • Glossary
  • News Briefs
  • News Stories
  • Newsletters
  • Publications

Cool Stuff

  • Apps
  • Digital Fishers
  • iBooks & e-Pubs
  • Live Video
  • Maps
  • Images
  • State of the Ocean

Data & Tools

  • Apps
  • Data Plots
  • Data Search
  • Data Policy
  • Data Help
  • OPeNDAP Web Services

Opportunities

  • Calendar
  • Educator Opportunities
  • Global Partnerships
  • Industry Network
  • Jobs
  • Staff List
  • Technology Services

Sites & Instruments

  • Arctic Sites
  • Northeast Pacific Sites
  • Salish Sea Sites
  • Notice to Mariners

Follow Us

Facebook iconTwitter iconLinkedIn iconYouTube iconFlickr iconInstagram icon

Sign up for our newsletter

Feedback

CAPTCHA
This question is for testing whether or not you are a human visitor and to prevent automated spam submissions.
Image CAPTCHA
Enter the characters shown in the image.


About Us | Contact Us | Media Relations | Legal Notices

©   Ocean Networks Canada. All rights reserved.  2474 Arbutus Road, Victoria, BC, V8N 1V8 | 1.250.472.5400