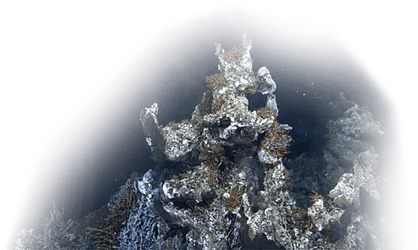
Our permanent observatory installations include core oceanographic sensors that monitor a variety of seawater properties. Key properties include temperature, salinity, pressure (a measure of the weight of water above the sensor) and density (a function of temperature, salinity, and pressure). At several locations, we also measure the amount of dissolved oxygen in the ocean.
These plots are generated daily to show the seasonal and annual changes in oxygen (O; purple), density (σ; blue), salinity (S; green), and temperature (T; red).
